dpodsiadlo/svg-charts
SVG Charts Generator for Laravel & DOMPDF
3,146
8
| Install | |
|---|---|
composer require dpodsiadlo/svg-charts |
|
| Latest Version: | v1.0.5 |
| PHP: | >=5.6 |
| License: | MIT |
| Last Updated: | Jul 10, 2024 |
| Links: | GitHub · Packagist |
Maintainer: Daniel Podsiadło
SVG Charts
A package for Laraver to generate SVG charts compatible with DOMPDF.
Installation
Via Composer
$ composer require dpodsiadlo/svg-charts
Configuration (only if you have auto discovery disabled)
Once installed, register Laravel service provider, in your config/app.php:
'providers' => [
	...
    DPodsiadlo\SvgCharts\Providers\SvgChartsProvider::class,
]
Customize
To customize the chart you can publish the view to /resources/views/vendor/svg-charts:
php artisan vendor:publish --provider="DPodsiadlo\SvgCharts\Providers\SvgChartsProvider"
Basic Usage
Line chart
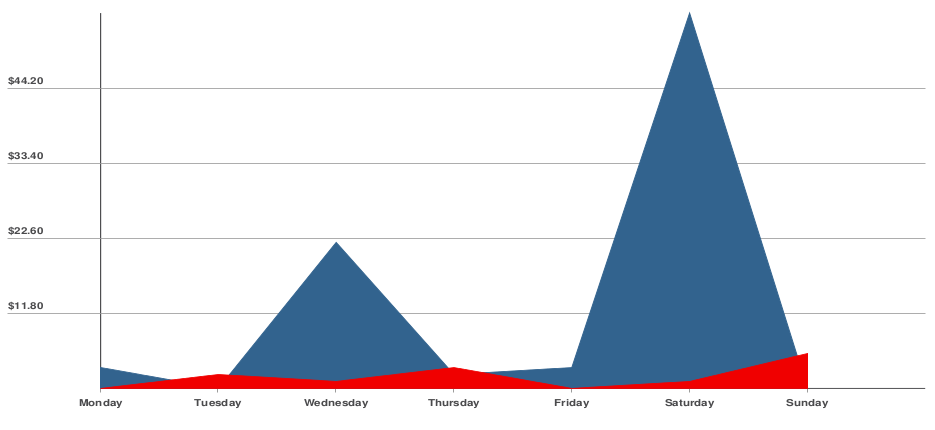
Blade template implementation:
@inject('svgCharts', '\DPodsiadlo\SvgCharts\SvgCharts')     {{-- Injecting the service --}}

<img style="width: 174mm; height: 80mm"
     src="{{$svgCharts->lineChart([
            'labels' => [
                'Monday',
                'Tuesday',
                'Wednesday',
                'Thursday',
                'Friday',
                'Saturday',
                'Sunday'
            ],
            'data' => [
                [4,1,22,3,4,55,1],                          // First dataset
                [1,3,2,4,1,2,6]                             // Second dataset

            ]
         ],[
        'colors' => ['#32638e','#f00000'],                  // Colors for datasets
        'fillColor' => ['#32638e','#f00000'],
        'stroke' => 1,
        'axisColor' => '#4a4a4c',
        'axisWidth' => 2,
        'gridColor' => '#9c9c9b',
        'gridWidth' => 1,
        'valueGroups' => 5,
        'width' => 1600,
        'height' => 900,
        'valueFormatter' => function($value){               // Closure for formatting values
            return money_format("%.2n", $value);            // Used setlocale(LC_MONETARY, 'en_US.UTF-8') for this example
        }
     ])->toImgSrc()}}"/>
License
The MIT License (MIT). Please see License File for more information.