jonpurvis/radial
Radial
Radial is a companion for Flux UI, adding donut and pie charts styled to match Flux’s look and feel. Simple to use, with hover effects, legends, and dark mode support.
| Light | Dark |
|---|---|
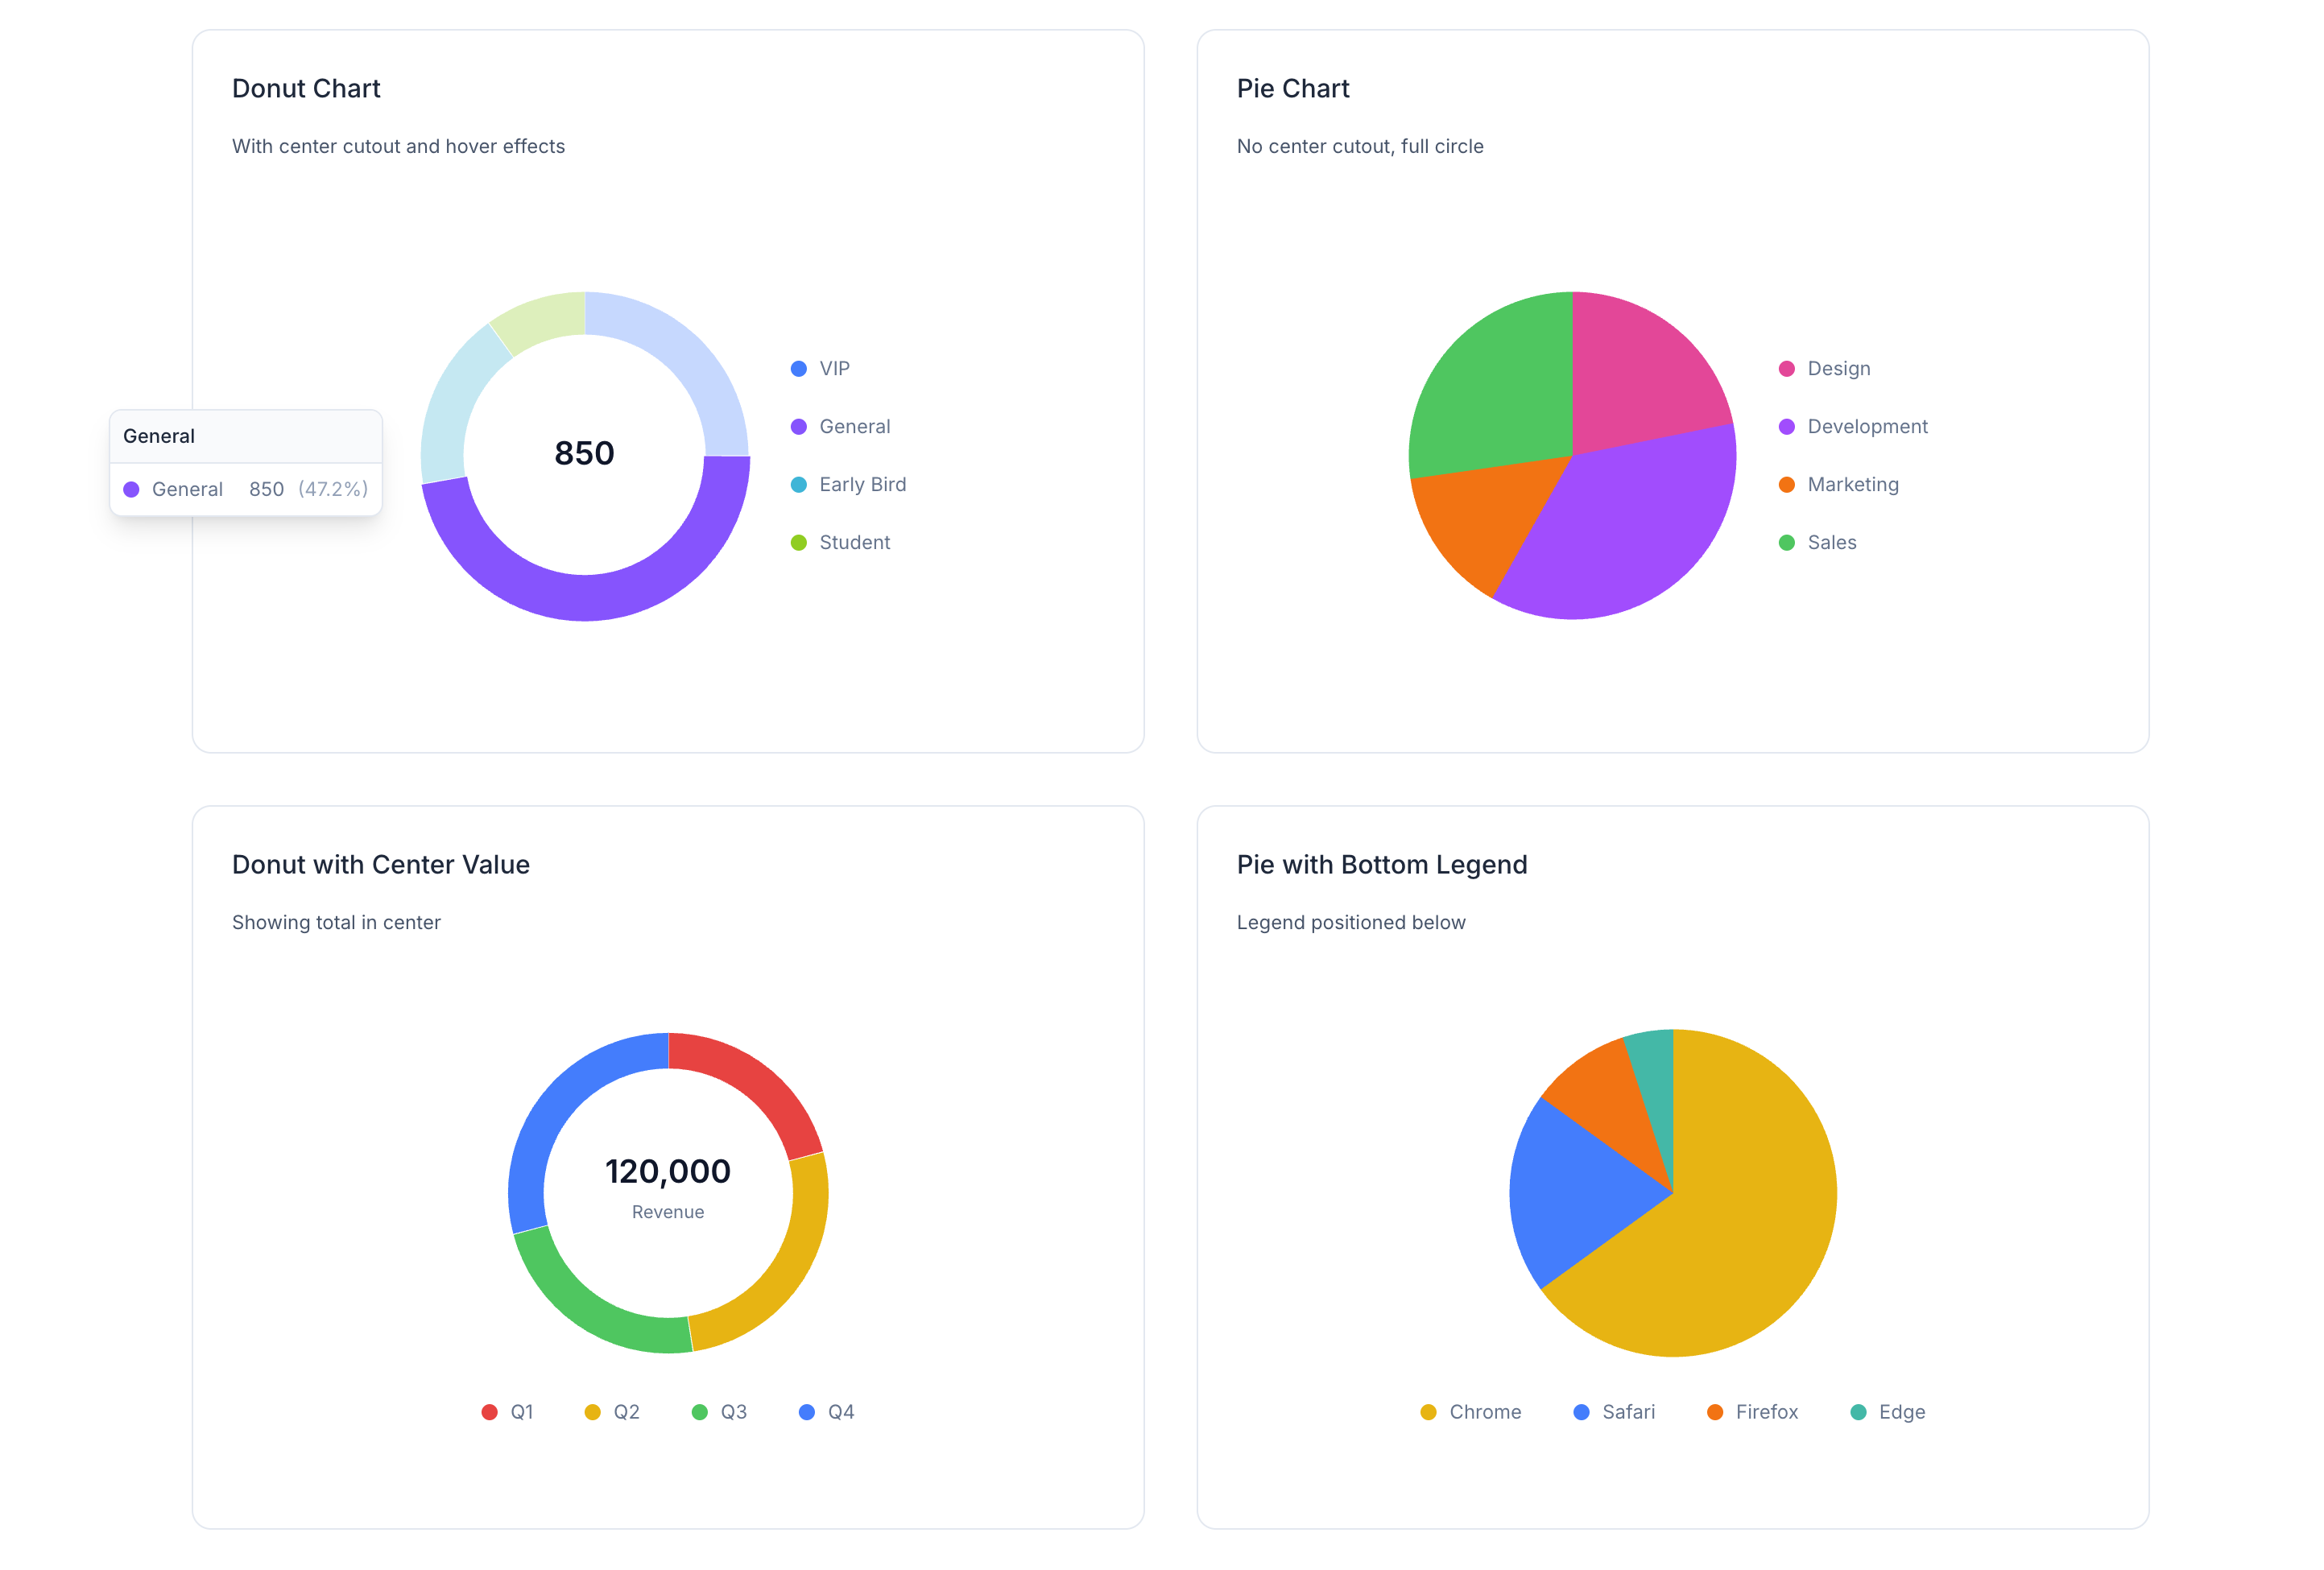 |
 |
Installation
composer require jonpurvis/radial
Data Structure
Both components use the same segment format. Each segment requires label, value, and class:
$data = [
    ['label' => 'Critical', 'value' => 40, 'class' => 'text-red-500'],
    ['label' => 'Warning', 'value' => 25, 'class' => 'text-yellow-500'],
    ['label' => 'Healthy', 'value' => 35, 'class' => 'text-green-500'],
];
| Key | Type | Description |
|---|---|---|
label |
string |
Segment name (shown in tooltip and, for donut, in center on hover) |
value |
int|float |
Segment value (determines arc size) |
class |
string |
Tailwind color class for the segment (e.g. text-blue-500) |
Donut Component
A radial chart with a number in the center, perfect for dashboards. Segments highlight on hover, showing values in a tooltip and in the center.
Basic usage
<radial:donut :data="$data" label="Total" />
Donut – all options
| Prop | Type | Default | Description |
|---|---|---|---|
data |
array |
[] |
Segments with label, value, and class (Tailwind color) |
label |
string|null |
null |
Center label shown below the value |
value |
int|float|null |
null |
Override center value (defaults to sum of data) |
hover |
string|null |
null |
Alternative label shown when hovering the center |
hoverLabel |
string|null |
null |
Alias for hover |
legend |
false|'top'|'bottom'|'left'|'right' |
false |
Show legend at specified position |
tooltip |
bool |
true |
Show tooltip on segment hover |
cutout |
int |
70 |
Inner hole size (0 = solid, 70 = donut, 90 = thin ring) |
static |
bool |
false |
Disable hover/tap interactions |
size |
string |
'13rem' |
Chart size (width/height) |
Donut examples
Legend on any side
<radial:donut :data="$data" legend="bottom" />
<radial:donut :data="$data" legend="top" />
<radial:donut :data="$data" legend="left" />
<radial:donut :data="$data" legend="right" />
Center hover label
<radial:donut :data="$data" label="Total" hover="All Categories" />
Thin ring (cutout 90)
<radial:donut :data="$data" :cutout="90" />
Custom center value
<radial:donut :data="$data" :value="85" label="Score" />
Static (no interactions)
<radial:donut :data="$data" :static="true" :tooltip="false" />
Sizing – use the class attribute; chart stays square:
<radial:donut :data="$data" class="size-64" />
<radial:donut :data="$data" class="max-w-xs mx-auto" />
Pie Component
A solid pie chart (no center hole). Same data structure as the donut; tooltips and legend work the same way.
Basic usage
<radial:pie :data="$data" />
Pie – all options
| Prop | Type | Default | Description |
|---|---|---|---|
data |
array |
[] |
Segments with label, value, and class (Tailwind color) |
legend |
false|'top'|'bottom'|'left'|'right' |
false |
Show legend at specified position |
tooltip |
bool |
true |
Show tooltip on segment hover |
static |
bool |
false |
Disable hover/tap interactions |
size |
string |
'13rem' |
Chart size (width/height) |
Pie examples
With legend
<radial:pie :data="$data" legend="right" />
Static
<radial:pie :data="$data" :static="true" :tooltip="false" />
Sizing
<radial:pie :data="$data" class="size-64" />
Styling
- Segment colors use the
classkey in each data item (e.g.text-green-500). - Center text (donut) and tooltips use Flux-style zinc colors.
- Full dark mode support.
Copy-paste examples
Drop these into a Flux/Livewire page to try the components.
Donut – minimal
@php
    $donutData = [
        ['label' => 'Critical', 'value' => 40, 'class' => 'text-red-500'],
        ['label' => 'Warning', 'value' => 25, 'class' => 'text-yellow-500'],
        ['label' => 'Healthy', 'value' => 35, 'class' => 'text-green-500'],
];
@endphp

<radial:donut :data="$donutData" label="Total" />
Donut – with legend and center hover
@php
    $donutData = [
        ['label' => 'Critical', 'value' => 40, 'class' => 'text-red-500'],
        ['label' => 'Warning', 'value' => 25, 'class' => 'text-yellow-500'],
        ['label' => 'Healthy', 'value' => 35, 'class' => 'text-green-500'],
];
@endphp

<radial:donut :data="$donutData" label="Total" hover="All items" legend="bottom" />
Pie – minimal
@php
    $pieData = [
        ['label' => 'A', 'value' => 30, 'class' => 'text-blue-500'],
        ['label' => 'B', 'value' => 50, 'class' => 'text-emerald-500'],
        ['label' => 'C', 'value' => 20, 'class' => 'text-amber-500'],
];
@endphp

<radial:pie :data="$pieData" />
Pie – with legend
@php
    $pieData = [
        ['label' => 'A', 'value' => 30, 'class' => 'text-blue-500'],
        ['label' => 'B', 'value' => 50, 'class' => 'text-emerald-500'],
        ['label' => 'C', 'value' => 20, 'class' => 'text-amber-500'],
];
@endphp

<radial:pie :data="$pieData" legend="right" />
Side-by-side donut and pie
@php
    $chartData = [
        ['label' => 'Critical', 'value' => 40, 'class' => 'text-red-500'],
        ['label' => 'Warning', 'value' => 25, 'class' => 'text-yellow-500'],
        ['label' => 'Healthy', 'value' => 35, 'class' => 'text-green-500'],
];
@endphp

<div class="flex flex-wrap gap-8 justify-center items-start">
    <radial:donut :data="$chartData" label="Total" legend="bottom" />
    <radial:pie :data="$chartData" legend="right" />
</div>
Contributing
Contributions are welcome. Please open an issue or pull request on GitHub.
License
MIT