karim-tao/laravel-server-status
| Install | |
|---|---|
composer require karim-tao/laravel-server-status |
|
| Latest Version: | 0.1.0 |
| PHP: | ^8.3 |
| Laravel: | 12 · 13 |
| License: | MIT |
| Last Updated: | Sep 7, 2026 |
| Links: | GitHub · Packagist |
Laravel Server Status


A Livewire component that shows the current CPU, load, memory, disk, uptime and PHP processes of the server. Values are read when the page is open, with no daemon and no database.
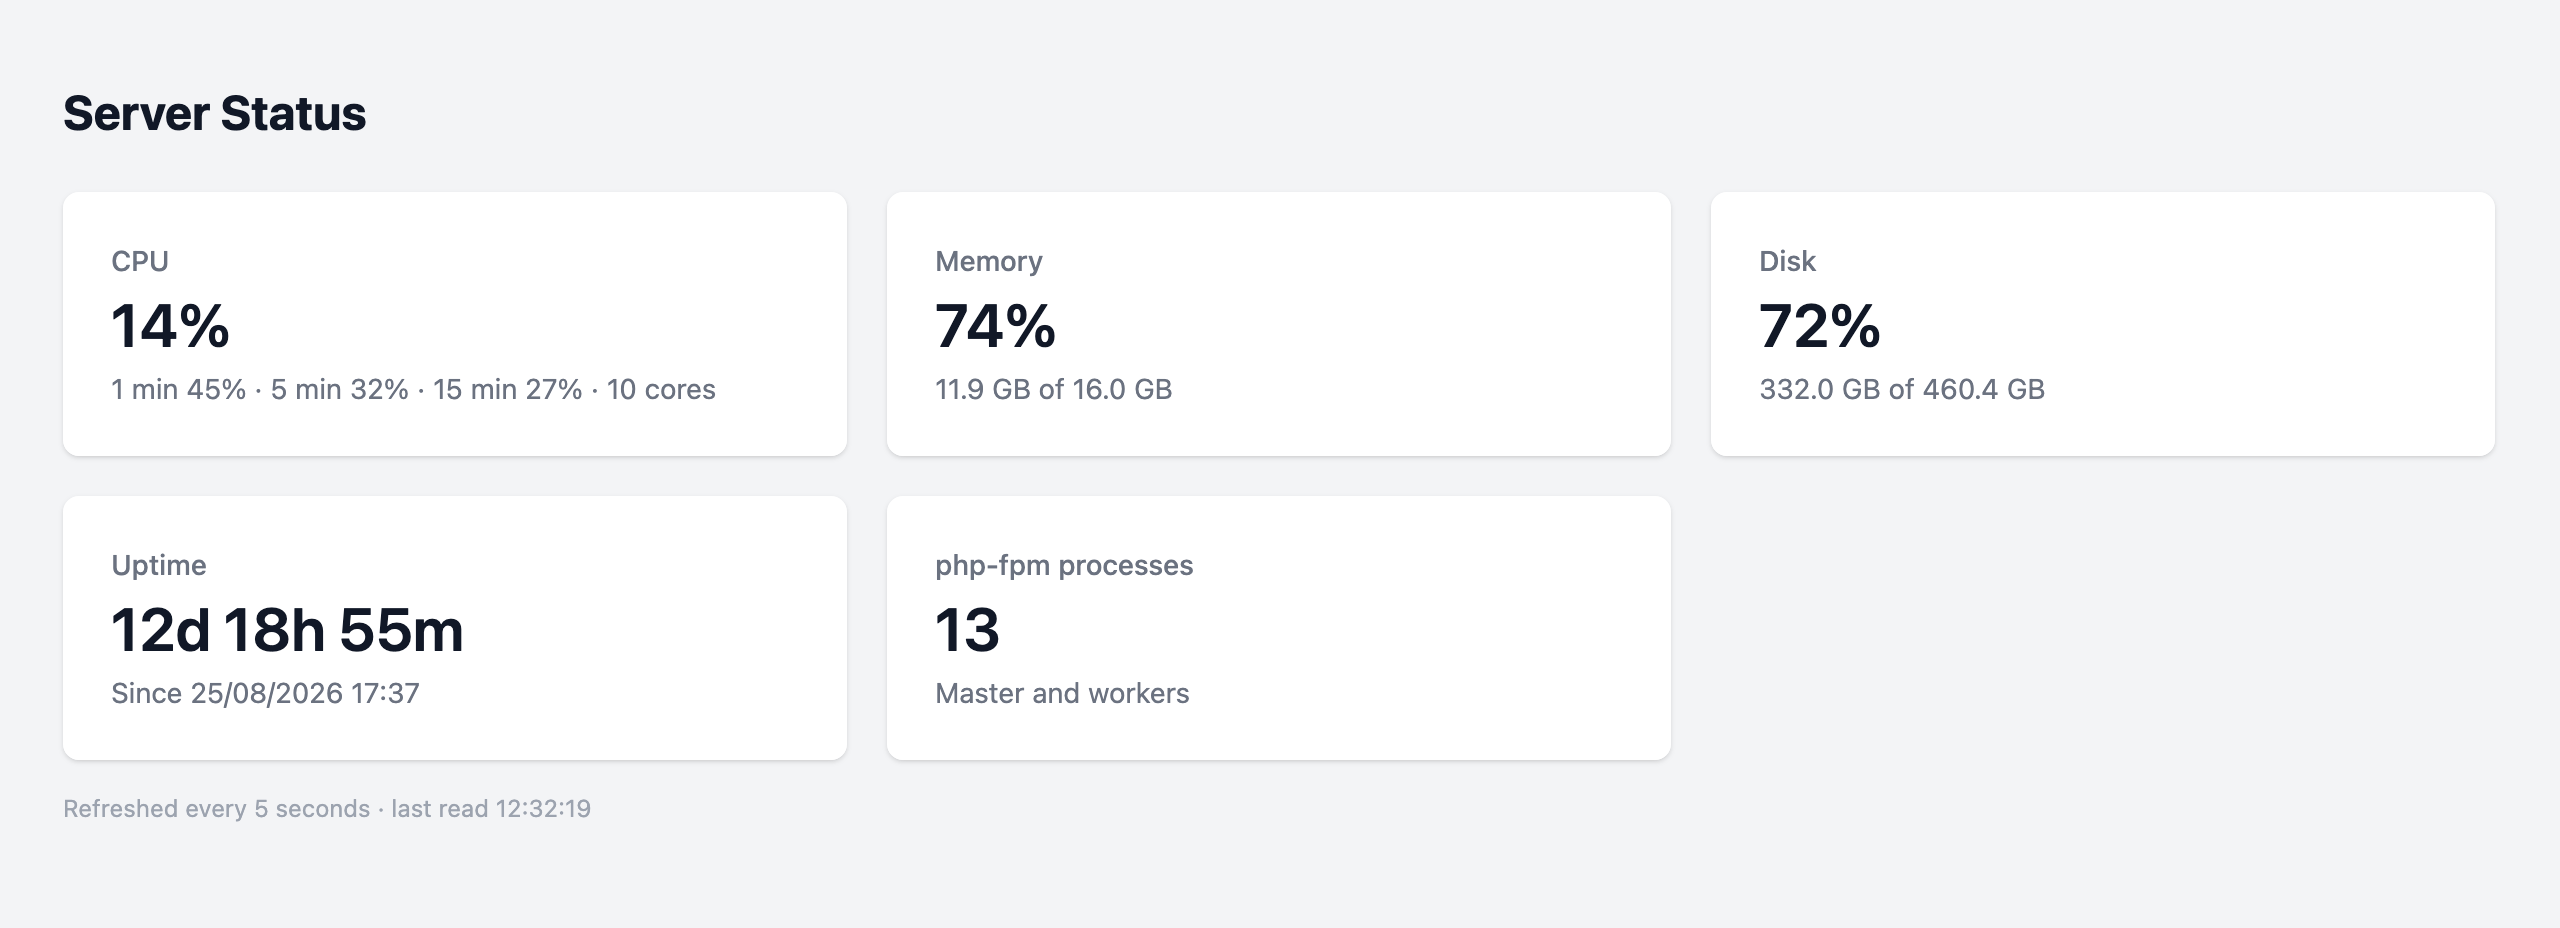
Add it to a Blade view:
<livewire:server-status />
Or read the values in code:
$snapshot = app(ServerMetrics::class)->read();

$snapshot->cpu;        // %
$snapshot->memoryUsed; // bytes
$snapshot->diskUsed;   // bytes
Installation
Requires PHP 8.3+, Laravel 12 or 13 and Livewire 3 or 4.
You can install the package via composer:
composer require karim-tao/laravel-server-status
That's it — the ServerStatusServiceProvider and the server-status Livewire component are auto-discovered, so you're ready to go.
Usage
In your own layout
Embed the component wherever you want, for example in an admin dashboard:
@extends('admin.layout')

@section('content')
    <livewire:server-status />
@endsection
The card refreshes every 5 seconds while it is on screen.
Standalone page
A ready-made page with the card is available too. Route it with the middleware you prefer:
use KarimTao\ServerStatus\Http\Controllers\ServerStatusController;

Route::get('/server-status', ServerStatusController::class)->middleware('auth');
Reading the metrics yourself
Everything the card shows comes from ServerMetrics, which you can use on its own — in a command, an API endpoint or a health check:
use KarimTao\ServerStatus\ServerMetrics;

$snapshot = app(ServerMetrics::class)->read();

$snapshot->cpu;         // percent
$snapshot->load;        // percents over 1, 5 and 15 minutes
$snapshot->cores;       // count
$snapshot->memoryUsed;  // bytes
$snapshot->memoryTotal; // bytes
$snapshot->diskUsed;    // bytes
$snapshot->diskTotal;   // bytes
$snapshot->uptime;      // seconds
$snapshot->process;     // name
$snapshot->processes;   // count
How it works
- Linux reads
/procandtop. - macOS uses
sysctl,vm_statandtop. - Windows uses PowerShell.
- Disk uses PHP's
disk_total_space()anddisk_free_space(). - Processes counts the processes named like the one serving the request,
php-fpmfor example. - No fallbacks. A value that cannot be read throws
MetricUnavailableException, saying what failed.
Testing
composer test
Each reader is tested on its own system and skipped elsewhere.
License
Laravel Server Status is open-sourced software licensed under the MIT license.
Related Packages
Laravel package to periodically monitor the health of your server and website.
Monitors Livewire update requests for deserialization attack patterns (CVE-2025-...
A powerful Laravel debugging tool with real-time monitoring, query debugging, an...
A Livewire Dropzone component for simple drag-and-drop file uploads.
A powerful livewire rich text editor component built top of Quill.
Version History
| Version | Released | PHP | Laravel | License |
|---|---|---|---|---|
| 0.1.0 | ^8.3 | ^12.0 || | MIT |