laraveldaily/filawidgets
| Install | |
|---|---|
composer require laraveldaily/filawidgets |
|
| Latest Version: | v0.1.2 |
| PHP: | ^8.2 |
| Laravel: | 11 · 12 · 13 |
| License: | MIT |
| Last Updated: | Mar 25, 2026 |
| Links: | GitHub · Packagist |
FilaWidgets
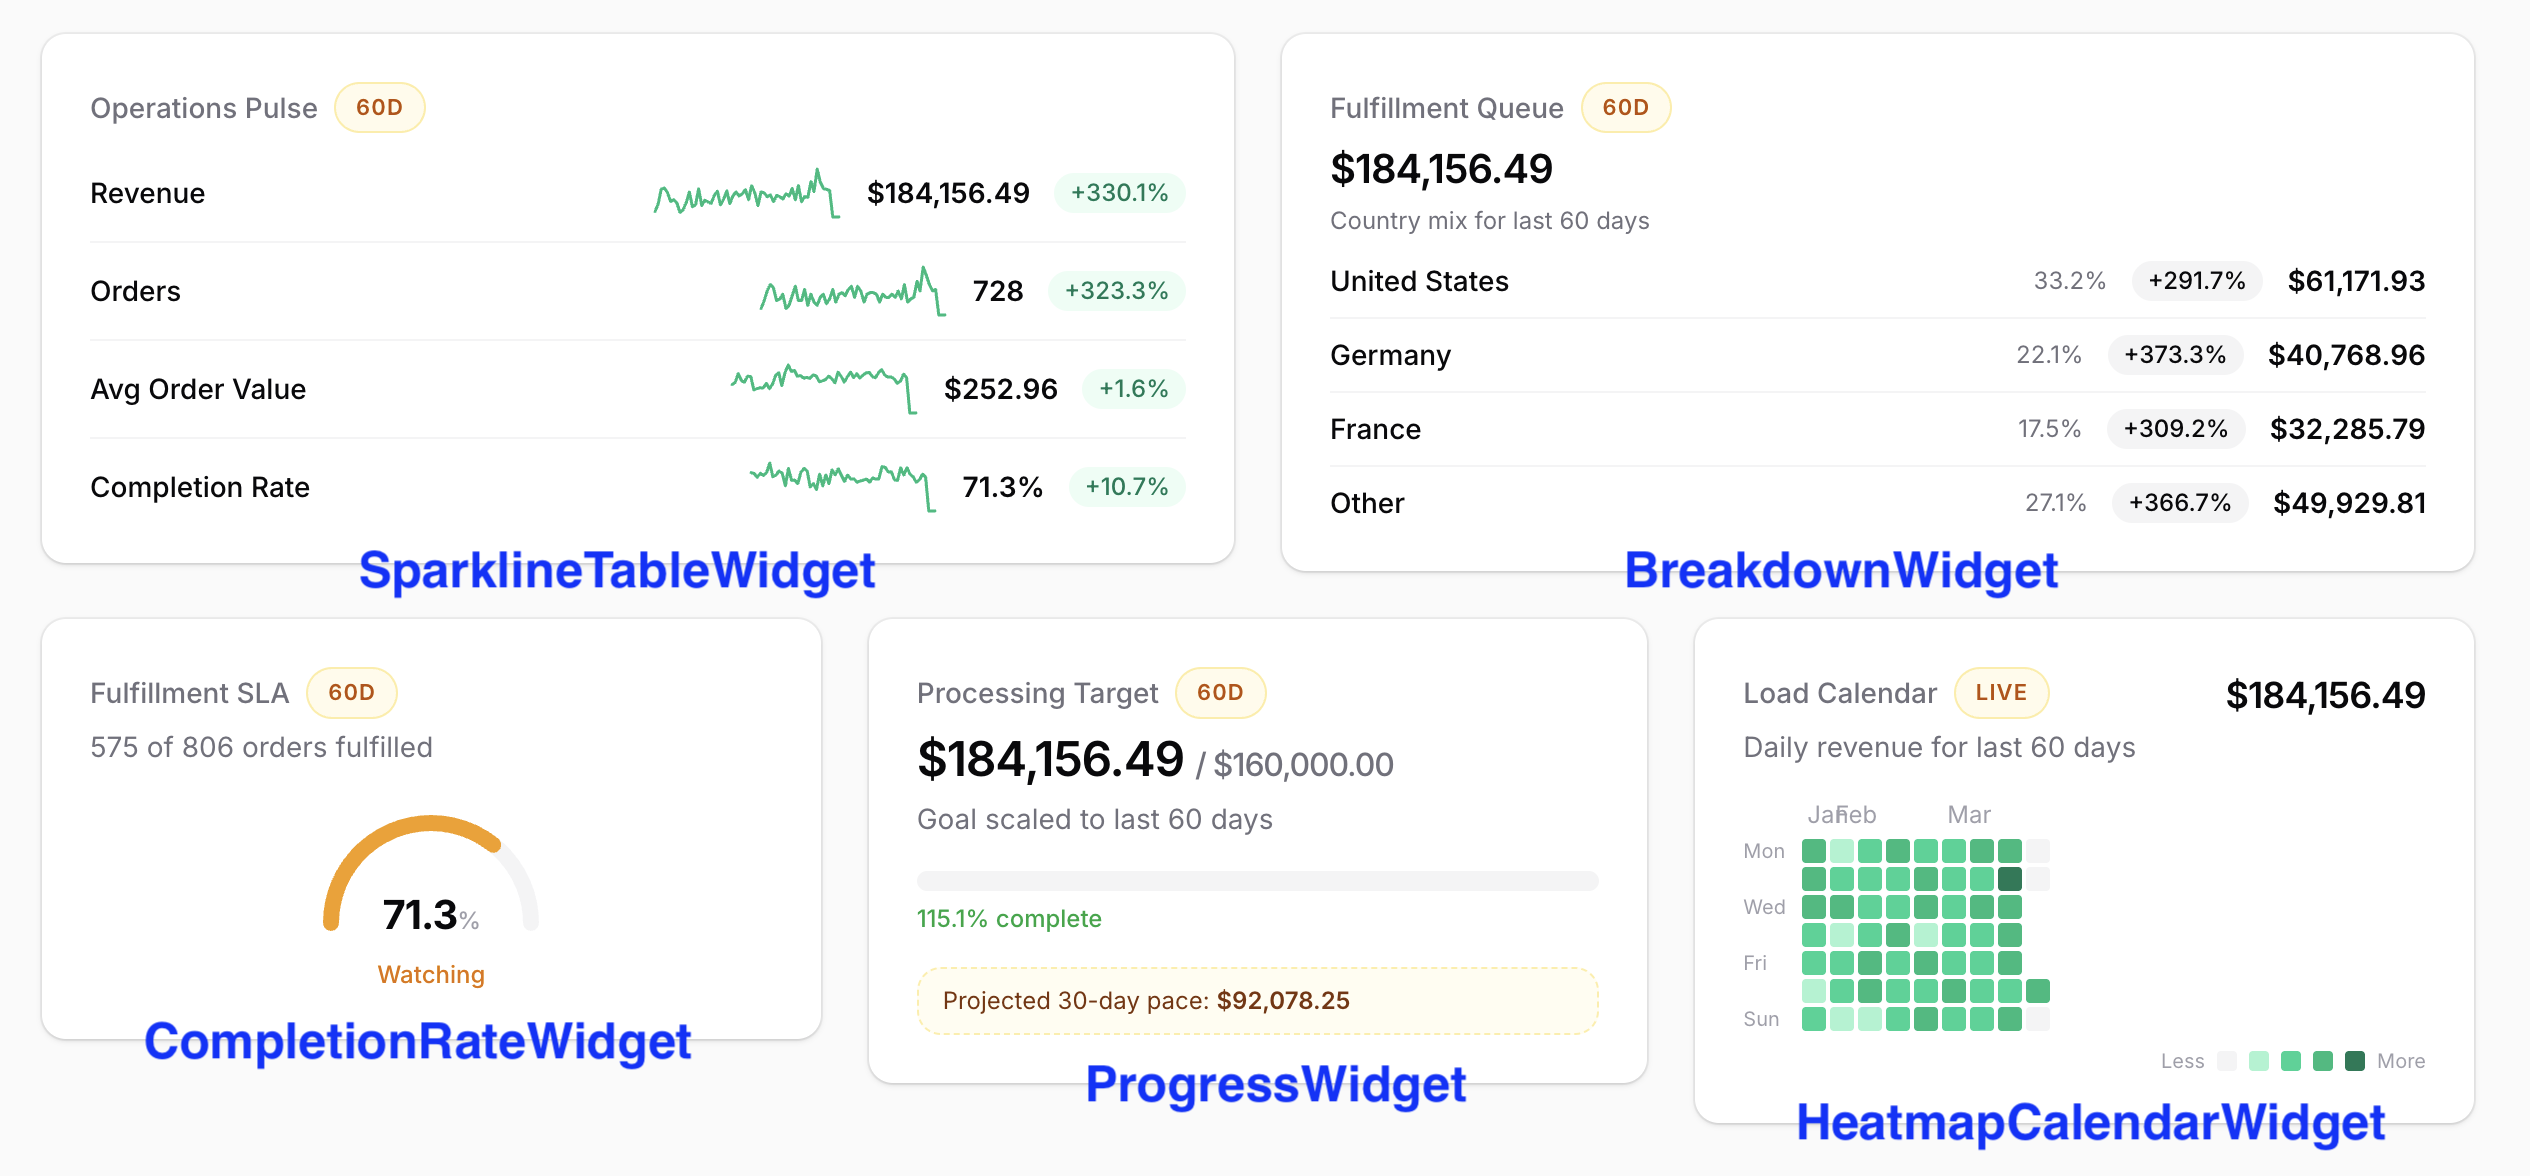
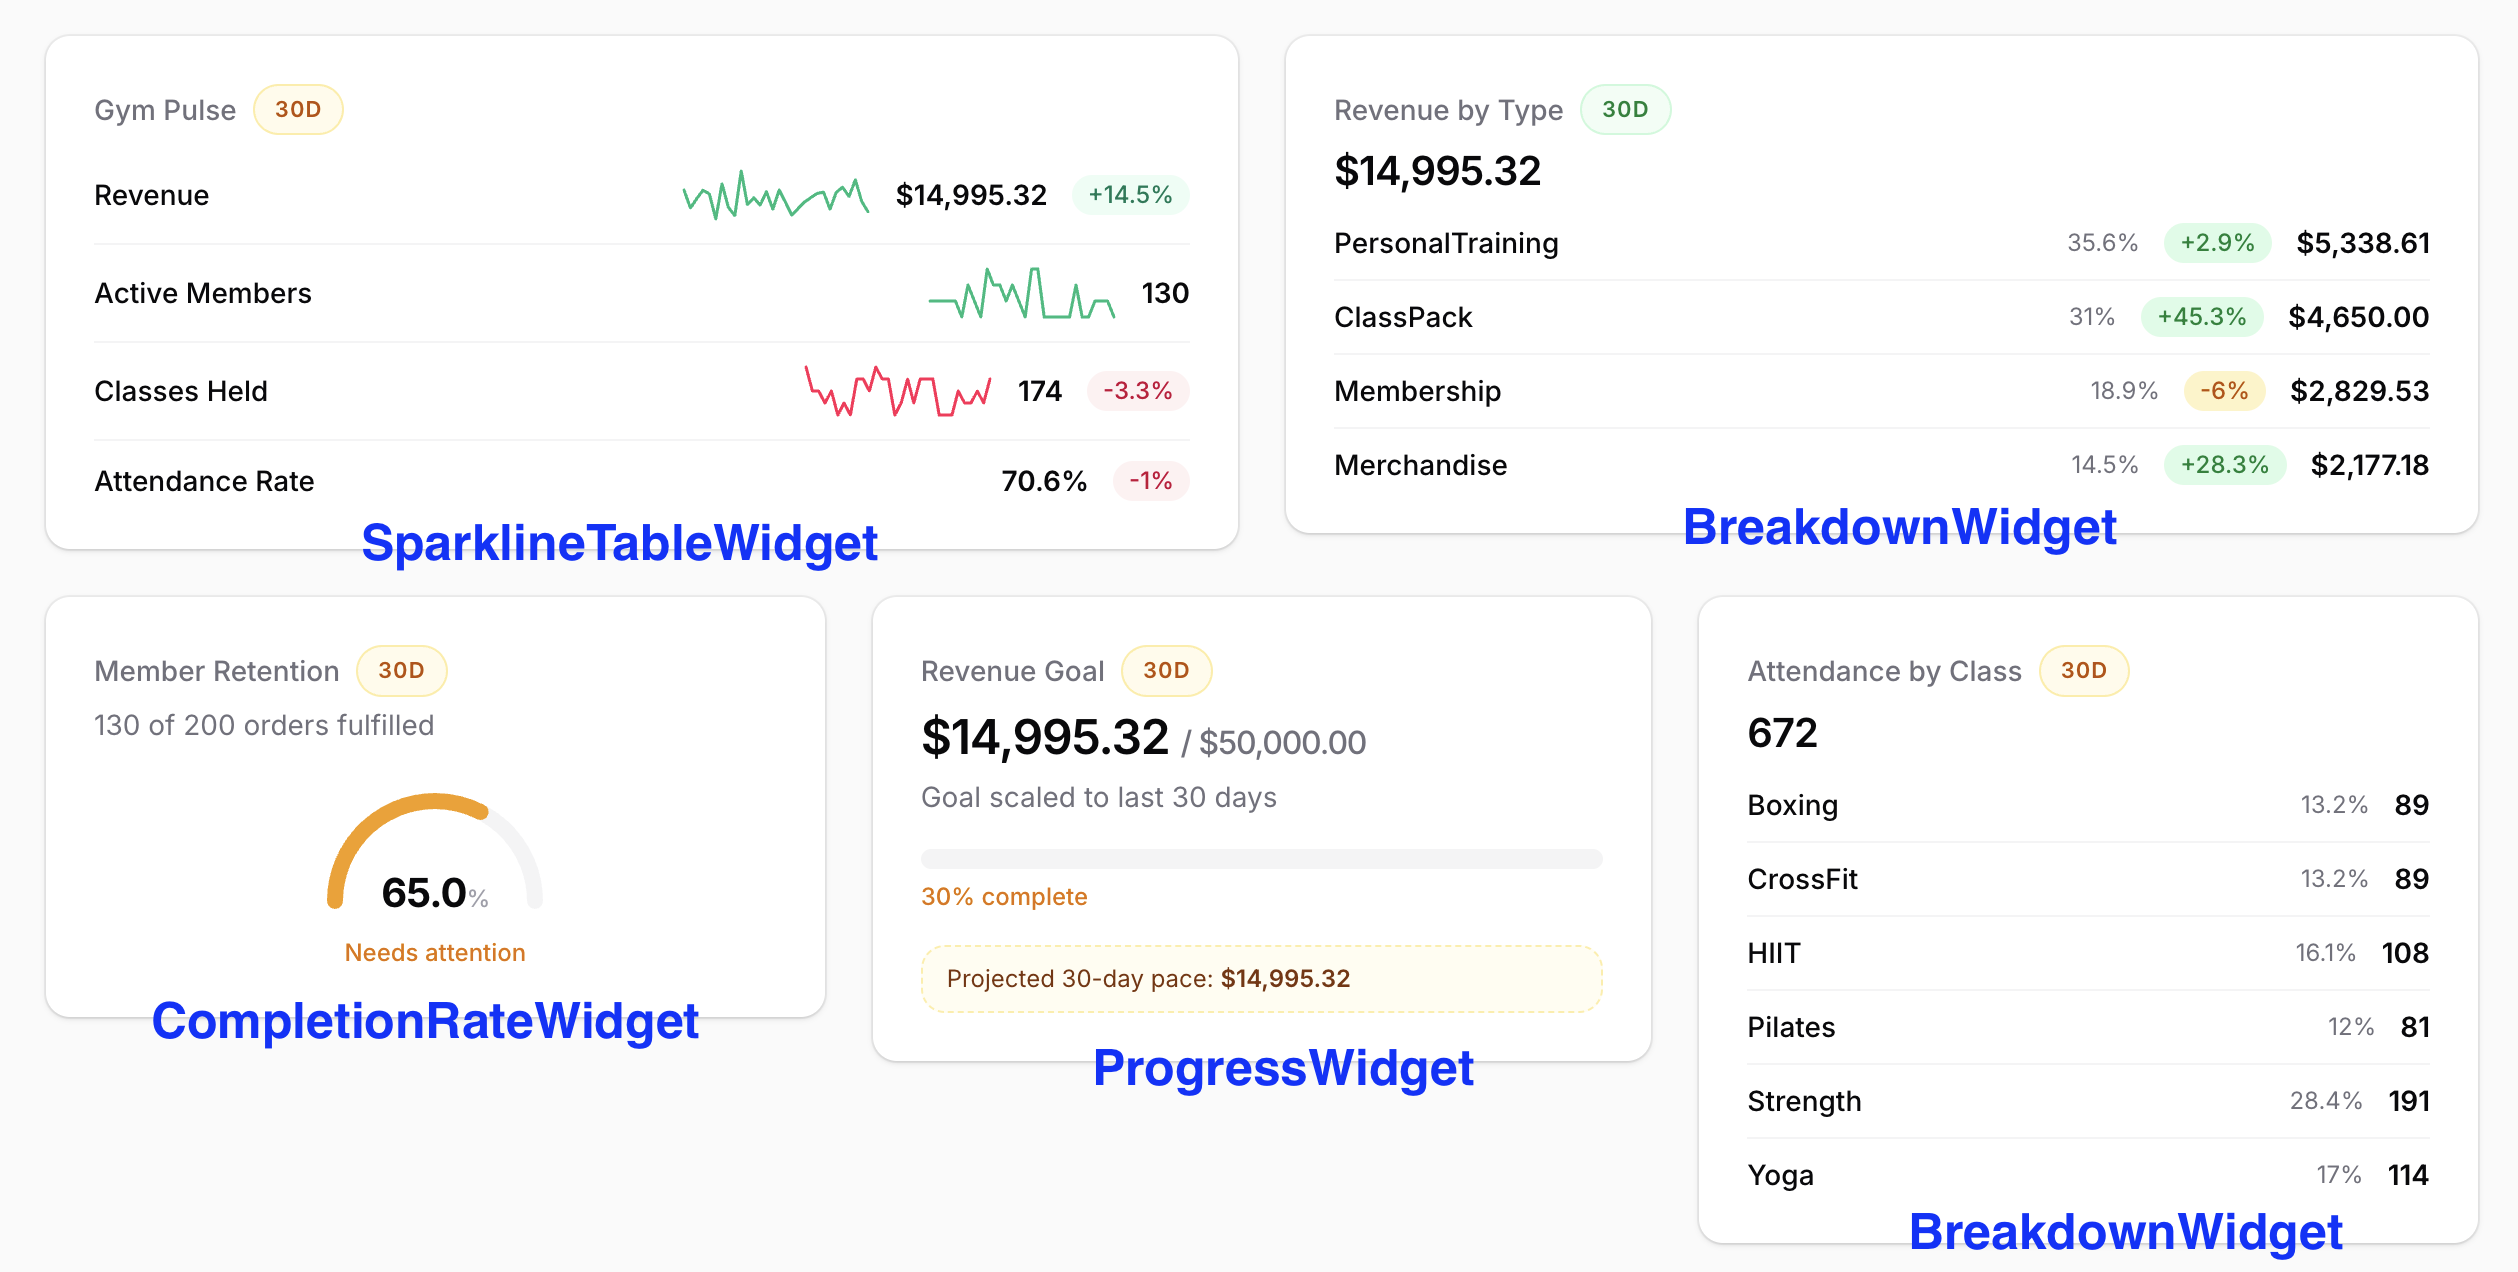
Reusable Filament dashboard widgets for Laravel. Five widget types — sparkline tables, breakdowns, progress bars, completion rate gauges, and heatmap calendars — that work on dashboards, resource pages, or any Filament page.
Requirements
- PHP 8.2+
- Laravel 11+
- Filament 4+
Installation
composer require laraveldaily/filawidgets
The service provider auto-registers via Composer's package discovery.
Custom Theme (Required)
This package uses Tailwind CSS classes that are not included in Filament's default compiled styles. You need a custom Filament theme so that Tailwind can scan the package's Blade views.
1. Create a theme (if you don't have one already):
php artisan make:filament-theme
Follow the instructions the command prints — it will add the theme to vite.config.js and your panel provider.
2. Add the package views to your theme CSS file (resources/css/filament/{panel}/theme.css):
@import '../../../../vendor/filament/filament/resources/css/theme.css';

@source '../../../../app/Filament/**/*';
@source '../../../../resources/views/filament/**/*';
@source '../../../../vendor/laraveldaily/filawidgets/resources/views/**/*';
Add this last line with vendor/laraveldaily/filawidgets.
3. Rebuild your assets:
npm run build
(or npm run dev)
Quick Start: Create Widgets
Scaffold a widget with the artisan command:
php artisan make:filawidget
The command prompts for a name and widget type interactively. You can also pass them directly:
php artisan make:filawidget RevenueByRegionWidget --type=Breakdown
Available types: SparklineTable, Breakdown, Progress, CompletionRate, HeatmapCalendar.
The generated class is placed in app/Filament/Widgets/ with a minimal skeleton — just fill in your query logic.
Every widget follows the same pattern: extend the base class, set properties, implement getData().
use LaravelDaily\FilaWidgets\Data\BreakdownItemData;
use LaravelDaily\FilaWidgets\Data\BreakdownWidgetData;
use LaravelDaily\FilaWidgets\Widgets\BreakdownWidget;

class RevenueByRegionWidget extends BreakdownWidget
{
    protected ?string $widgetLabel = 'Revenue by Region';
    protected ?int $itemLimit = 4;
    protected bool $groupOther = true;

    protected function getData(): BreakdownWidgetData
    {
        // Your query logic here
        return new BreakdownWidgetData(items: [
            new BreakdownItemData('United States', 27378.77, previousValue: 23120.50),
            new BreakdownItemData('Germany', 17230.02, previousValue: 13520.00),
            new BreakdownItemData('Lithuania', 11989.15, previousValue: 8840.30),
        ], description: 'Country mix for last 30 days');
    }
}
Displaying Widgets
Dashboard (auto-discovery): Filament auto-discovers widgets in app/Filament/Widgets/, so widgets created with make:filawidget appear on the default dashboard automatically — no registration needed.
Custom dashboard page: If you have a custom dashboard, register widgets explicitly:
public function getWidgets(): array
{
    return [RevenueByRegionWidget::class];
}
Resource or custom pages: Add widgets to any page's header or footer:
protected function getHeaderWidgets(): array
{
    return [
        RevenueByRegionWidget::make(['range' => 'last_30_days']),
    ];
}
When range is passed directly, the widget does not depend on dashboard page filters.
Widget Types
1. SparklineTableWidget
A multi-row metric table with inline SVG sparkline charts and trend badges.
Base class: LaravelDaily\FilaWidgets\Widgets\SparklineTableWidget
Default column span: ['md' => 1, 'xl' => 3]
use LaravelDaily\FilaWidgets\Data\SparklineTableRowData;
use LaravelDaily\FilaWidgets\Data\SparklineTableWidgetData;
use LaravelDaily\FilaWidgets\Support\SparklineSeries;
use LaravelDaily\FilaWidgets\Widgets\SparklineTableWidget;

class RevenuePulseWidget extends SparklineTableWidget
{
    protected ?string $widgetLabel = 'Revenue Pulse';

    protected function getData(): SparklineTableWidgetData
    {
        $dateRange = DashboardDateRange::fromFilter($this->getRangeFilter());
        [$currentStart, $currentEnd] = $dateRange->currentPeriod();
        [$previousStart, $previousEnd] = $dateRange->previousPeriod();

        $baseQuery = Order::query()->where('status', OrderStatus::Completed);

        return SparklineTableWidgetData::fromRows(
            new SparklineTableRowData(
                label: 'Revenue',
                value: (float) (clone $baseQuery)->whereBetween('created_at', [$currentStart, $currentEnd])->sum('amount'),
                previousValue: (float) (clone $baseQuery)->whereBetween('created_at', [$previousStart, $previousEnd])->sum('amount'),
                sparkline: SparklineSeries::daily($currentStart, $currentEnd, clone $baseQuery, 'SUM(amount)'),
                format: 'currency',
            ),
            new SparklineTableRowData(
                label: 'Orders',
                value: (float) (clone $baseQuery)->whereBetween('created_at', [$currentStart, $currentEnd])->count(),
                previousValue: (float) (clone $baseQuery)->whereBetween('created_at', [$previousStart, $previousEnd])->count(),
                sparkline: SparklineSeries::daily($currentStart, $currentEnd, clone $baseQuery, 'COUNT(*)'),
                format: 'number',
                precision: 0,
            ),
        );
    }
}
SparklineTableRowData
| Parameter | Type | Default | Description |
|---|---|---|---|
label |
string |
required | Row label |
value |
float |
required | Current period value |
previousValue |
?float |
null |
Previous period value (enables trend badge) |
sparkline |
array<int, float> |
[] |
Ordered daily data points for the SVG chart |
format |
?string |
null |
'currency', 'number', or 'percentage' (falls back to widget default) |
precision |
?int |
null |
Decimal places (falls back to widget default) |
url |
?string |
null |
Makes the row clickable |
openUrlInNewTab |
bool |
false |
Open URL in new tab |
color |
?string |
null |
Per-row color ('success', 'warning', 'danger') for sparkline and badge |
showSparkline |
bool |
true |
Set false to hide the sparkline for this row |
SparklineSeries Helper
Builds a zero-filled daily float array from a query. Eliminates the most common boilerplate:
use LaravelDaily\FilaWidgets\Support\SparklineSeries;

$series = SparklineSeries::daily(
    start: $start,                    // CarbonInterface
    end: $end,                        // CarbonInterface
    query: Order::query()->where(...), // Eloquent Builder (cloned internally)
    aggregate: 'SUM(amount)',          // Raw SQL aggregate
    dateColumn: 'created_at',          // Column to group by (default)
    precision: 2,                      // Decimal rounding (default)
);
// Returns: [0.0, 150.50, 0.0, 320.00, ...]  (one float per day)
2. BreakdownWidget
A ranked list showing each item's value, contribution percentage, and period-over-period delta.
Base class: LaravelDaily\FilaWidgets\Widgets\BreakdownWidget
Default column span: ['md' => 1, 'xl' => 3]
use LaravelDaily\FilaWidgets\Data\BreakdownItemData;
use LaravelDaily\FilaWidgets\Data\BreakdownWidgetData;
use LaravelDaily\FilaWidgets\Widgets\BreakdownWidget;

class RevenueByRegionWidget extends BreakdownWidget
{
    protected ?string $widgetLabel = 'Revenue by Region';
    protected ?int $itemLimit = 4;
    protected bool $groupOther = true;

    protected function getData(): BreakdownWidgetData
    {
        $dateRange = DashboardDateRange::fromFilter($this->getRangeFilter());
        [$currentStart, $currentEnd] = $dateRange->currentPeriod();
        [$previousStart, $previousEnd] = $dateRange->previousPeriod();

        $currentItems = $this->totalsByCountry($currentStart, $currentEnd);
        $previousItems = $this->totalsByCountry($previousStart, $previousEnd);

        $items = $currentItems
            ->keys()
            ->merge($previousItems->keys())
            ->unique()
            ->map(fn (string $country): BreakdownItemData => new BreakdownItemData(
                label: $this->countryName($country),
                value: (float) ($currentItems[$country] ?? 0),
                previousValue: (float) ($previousItems[$country] ?? 0),
            ))
            ->sortByDesc(fn (BreakdownItemData $item): float => $item->value)
            ->values()
            ->all();

        return new BreakdownWidgetData(
            items: $items,
            description: 'Country mix for ' . strtolower($dateRange->label()),
        );
    }
}
BreakdownWidget Properties
| Property | Type | Default | Description |
|---|---|---|---|
$itemLimit |
?int |
null |
Max rows to display |
$groupOther |
bool |
false |
Aggregate overflow rows into "Other" |
$sortBy |
string |
'value' |
Sort field ('value' or 'label') |
$sortDirection |
string |
'desc' |
'asc' or 'desc' |
$showContribution |
bool |
true |
Show contribution percentage column |
$showDelta |
bool |
true |
Show delta percentage badge |
$deltaThresholds |
array |
[] |
Color thresholds for delta badges |
BreakdownItemData
| Parameter | Type | Default | Description |
|---|---|---|---|
label |
string |
required | Item name |
value |
float |
required | Current value |
previousValue |
?float |
null |
Previous period value (enables delta) |
color |
?string |
null |
Row color ('success', 'warning', 'danger', 'primary') |
icon |
?string |
null |
Heroicon name for the row |
url |
?string |
null |
Makes the row clickable |
BreakdownWidgetData::fromCollection()
Build from query results without manual mapping:
// From an array of associative arrays
$data = BreakdownWidgetData::fromCollection(
    items: $queryResults,
    labelKey: 'category_name',
    valueKey: 'total_revenue',
    previousValueKey: 'previous_revenue',
    description: 'Revenue breakdown',
);

// From a keyed collection using closures
$data = BreakdownWidgetData::fromCollection(
    items: $totals,  // Collection<string, float>  e.g. ['US' => 15000, 'DE' => 8000]
    labelKey: fn ($value, $key) => $key,
    valueKey: fn ($value) => (float) $value,
);
3. ProgressWidget
A horizontal progress bar with goal tracking and optional projection.
Base class: LaravelDaily\FilaWidgets\Widgets\ProgressWidget
Default column span: ['md' => 1, 'xl' => 2]
use LaravelDaily\FilaWidgets\Widgets\ProgressWidget;

class RevenueGoalWidget extends ProgressWidget
{
    protected ?string $widgetLabel = 'Revenue Goal';
    protected float $goal = 50000;
    protected int $goalRangeDays = 30;

    protected function getCurrentValue(): float
    {
        $dateRange = DashboardDateRange::fromFilter($this->getRangeFilter());
        [$start, $end] = $dateRange->currentPeriod();

        return (float) Order::query()
            ->where('status', OrderStatus::Completed->value)
            ->whereBetween('created_at', [$start, $end])
            ->sum('amount');
    }
}
ProgressWidget Properties
| Property | Type | Default | Description |
|---|---|---|---|
$goal |
float |
0 |
Target value |
$goalRangeDays |
int |
30 |
Days for projection calculation |
$showProjection |
bool |
true |
Show projected pace box |
4. CompletionRateWidget
An SVG arc gauge showing a completion rate with threshold-based coloring.
Base class: LaravelDaily\FilaWidgets\Widgets\CompletionRateWidget
Default column span: ['md' => 1, 'xl' => 2]
use LaravelDaily\FilaWidgets\Widgets\CompletionRateWidget;

class FulfillmentRateWidget extends CompletionRateWidget
{
    protected ?string $widgetLabel = 'Fulfillment Rate';

    protected function getCounts(): array
    {
        $dateRange = DashboardDateRange::fromFilter($this->getRangeFilter());
        [$start, $end] = $dateRange->currentPeriod();

        $completed = Order::query()
            ->where('status', OrderStatus::Completed->value)
            ->whereBetween('created_at', [$start, $end])
            ->count();

        $total = Order::query()
            ->whereBetween('created_at', [$start, $end])
            ->count();

        return ['completed' => $completed, 'total' => $total];
    }

    protected function getThresholds(): array
    {
        return [
            ['threshold' => 50, 'color' => 'danger', 'label' => 'Critical'],
            ['threshold' => 75, 'color' => 'warning', 'label' => 'Needs attention'],
            ['threshold' => 100, 'color' => 'success', 'label' => 'Healthy'],
        ];
    }
}
5. HeatmapCalendarWidget
A GitHub-style heatmap grid showing daily activity density.
Base class: LaravelDaily\FilaWidgets\Widgets\HeatmapCalendarWidget
Default column span: ['md' => 2, 'xl' => 2]
use LaravelDaily\FilaWidgets\Data\HeatmapCalendarWidgetData;
use LaravelDaily\FilaWidgets\Widgets\HeatmapCalendarWidget;

class DailyRevenueWidget extends HeatmapCalendarWidget
{
    protected ?string $widgetLabel = 'Daily Revenue';

    protected function getData(): HeatmapCalendarWidgetData
    {
        $dateRange = DashboardDateRange::fromFilter($this->getRangeFilter());
        [$start, $end] = $dateRange->currentPeriod();

        $entries = Order::query()
            ->where('status', OrderStatus::Completed)
            ->whereBetween('created_at', [$start, $end])
            ->selectRaw('DATE(created_at) as date, SUM(amount) as total')
            ->groupBy('date')
            ->orderBy('date')
            ->pluck('total', 'date')
            ->map(fn ($value): float => round((float) $value, 2))
            ->all();

        return new HeatmapCalendarWidgetData(
            entries: $entries,  // ['2026-03-20' => 500.00, ...]
            description: 'Daily revenue for ' . strtolower($dateRange->label()),
        );
    }

    protected function getWeeksToShow(): int
    {
        return 9;
    }
}
HeatmapCalendarWidget Methods
| Method | Return Type | Default | Description |
|---|---|---|---|
getWeeksToShow() |
int |
12 |
Number of weeks to display |
getColorScheme() |
string |
'green' |
Color scheme: 'green' or 'blue' |
HeatmapCalendarWidgetData
| Parameter | Type | Default | Description |
|---|---|---|---|
entries |
array<string, float> |
required | Date-keyed values ('Y-m-d' => float) |
description |
?string |
null |
Subtitle text |
entryUrls |
array<string, string> |
[] |
Date-keyed URLs for clickable cells |
openEntryUrlsInNewTab |
bool |
false |
Open cell URLs in new tab |
Shared Configuration
All widgets inherit these properties from InteractsWithWidgetConfiguration:
| Property | Type | Default | Description |
|---|---|---|---|
$widgetLabel |
?string |
null |
Widget title |
$widgetFormat |
string |
'currency' |
Value format: 'currency', 'number', 'percentage' |
$widgetCurrency |
string |
'USD' |
ISO 4217 currency code |
$widgetPrecision |
int |
2 |
Decimal places |
$widgetColor |
string |
'primary' |
Theme color: 'primary', 'success', 'warning', 'danger' |
$widgetIcon |
Heroicon|string|null |
null |
Icon (Heroicon enum or string) |
$widgetEmptyStateHeading |
?string |
null |
Empty state title |
$widgetEmptyStateDescription |
?string |
null |
Empty state subtitle |
$widgetActionLabel |
?string |
null |
CTA button label |
$widgetActionUrl |
?string |
null |
CTA button URL |
$widgetActionOpenInNewTab |
bool |
false |
Open CTA in new tab |
$widgetCacheTtl |
?int |
null |
Cache TTL in seconds (null = no caching) |
$widgetCacheKey |
?string |
null |
Custom cache key prefix |
$range |
?string |
null |
Date range filter (public Livewire property) |
Date Range Filtering
Widgets resolve the date range from two sources, in priority order:
$rangeproperty (public Livewire prop) — passed directly viaWidget::make(['range' => 'last_7_days'])$pageFilters['range']— populated automatically on dashboard pages withHasFiltersForm
Access it in your widget with $this->getRangeFilter(), which returns the resolved ?string value.
Built-in range values: 'last_7_days', 'last_30_days' (default), 'last_60_days'.
Caching
Enable caching on any widget by setting the TTL:
protected ?int $widgetCacheTtl = 300;  // 5 minutes
protected ?string $widgetCacheKey = 'my-widget';  // Optional prefix
Cache keys are generated from the widget class, resolver, current filters, and options. Different filter combinations produce different cache entries automatically.
Value Formatting
The WidgetValueFormatter supports three formats:
| Format | Example | Description |
|---|---|---|
'currency' |
$1,234.56 |
Uses Number::currency() with configured currency code |
'number' |
1,234 |
Plain number with number_format() |
'percentage' |
85.67% |
Number with % suffix |
Set the format per widget ($widgetFormat) or per sparkline row (format parameter).
License
MIT
Related Packages
Powerful PHP database abstraction layer (DBAL) with many features for database s...
Laravel Serializable Closure provides an easy and secure way to serialize closur...
Cli error handling for console/command-line PHP applications.
Version History
| Version | Released | PHP | Laravel | License |
|---|---|---|---|---|
| v0.1.2 | ^8.2 | ^11.0| | MIT | |
| 0.1.0 | ^8.2 | ^11.0| | MIT |